A few years back, I developed a tool called web inspector remote - aka weinre. It's an interesting hack where I took the WebKit Web Inspector UI code, ran it in a plain old (WebKit-based) browser, and hooked things up so it could debug a web browser session running somewhere else. I was specifically targeting mobile web browsers and applications using web browser views, but there wasn't much (any?) mobile-specific code in weinre.
(btw, I currently run a publicly accessible weinre server at Bluemix)
One of the interesting aspects of weinre, is the way the browser running the debugger user interface (the client) communicates with the browser being debugged (the target). The WebKit Web Inspector code was originally designed so that the client would connect to the target in a traditional client/server pattern. But on mobile devices, or within a web browser environment, it's very difficult to run any kind of a tradtional "server" - tcp, http, or otherwise.
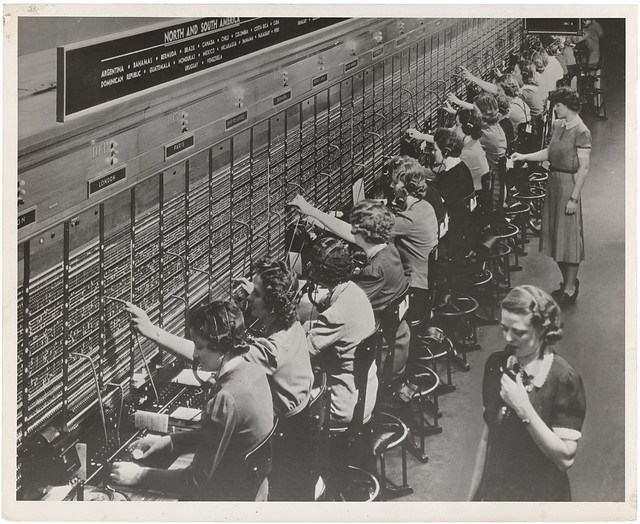
So the trick to make this work with weinre, is to have both the client and target connect as HTTP clients to an HTTP server that shuttles messages between the two. That HTTP server is the weinre server. It's basically just a message switchboard between debug clients and targets.
This switchboard server pattern is neat, because it allows two programs to interact with each other, where neither has to be an actual "server" of any kind (tcp, http, etc).
And this turns out to be a useful property in other environments as well. For instance, dealing with server farms running "in the cloud". Imagine you're running some kind of web application server, and decide to run 5 instances of your server to handle the load. And now you want to "debug" the server. How do you connect to it? Presumably the 5 instances are running behind one ip address - which server instance are you going to connect to? How could you connect to all of them at once?
Instead of using the typical client/server pattern for debugging in this environment, you can use the switchboard server pattern, and have each web application server instance connect to the switchboard server itself, and then have a single debug client which can communicate with all of the web application server instances.
I've wanted to extract the switchboard server pattern code out of weinre for a while now, and ... nows the time. I anticipate being able to define a generic switchboard server, and messaging protocol that can be used to allow multiple, independent, orthagonal tools to communicate with each other, where the tools are running in various environments. The focus here isn't specifically traditional graphical step debugging, but diagnostic tooling in general. Think loggers, REPLs, and other sorts of development tools.
One change I've made as part of the extraction is terminology. In weinre, there were "clients" and "targets" that had different capabilities. But there really doesn't need to be a distinction between the two, in terms of naming or functionality. Instead, I'm referring to these programs as "agents".
And sometimes agents will be communicating with agents running on other computers - remote agents - "ragents" - hey, that would be a cool name for a project!
Another thing I'm copying from the Web Inspector work is the messaging protocol. At the highest level, there are two types of messages that agents can send - request/response pairs, and events.
A request message can be sent from one agent to another, and then a response message is sent the opposite direction. Like RPC, or an HTTP request/response.
An event message is like a pub/sub message; multiple agents can listen for events, and then when an agent posts an event message, it's sent to every agent that is listening.
You can see concrete examples of these request/response and event messages in the V8 debugger protocol and the Chrome Remote Debugging Protocol.
This pattern makes it very easy to support things like having multiple debugger clients connect to a single debug target; all state change in the target gets emitted as events so every connected client will see the change. But you can also send specific requests from the client to the target, and only the client will see the responses.
For example, one debugger client might send a request "step" to have the debugger execute the next statement then pause. The response for this might be just a success/failure indicator. A set of events would end up being posted that the program started, and then stopped again (on the next statement). That way, every debugger client connected would see the effects of the "step" request.
Turns out, you really need to support multiple clients connected simultaneously if your clients are running in a web browser. Because if you only support a single client connection to your program, what happens when the user can't find their browser tab running the client? The web doesn't want to work with singleton connections.
I'm going to be working on the base libraries and server first, and then build some diagnostic tools that make use of them.
Stay tuned!
